CLASS 9TH DAY 7

INTRODUCTION

LINEAR EQUATIONS IN TWO VARIABLES

In earlier classes, you have studied linear equations in one variable. Can you write down a linear equation in one variable? you will say that x + 1 = 0, x + 2 = 0 and 2y + 3 = 0 are linear equations in one variable.

Let us now consider the following situation: In a One-day International Cricket match between India and Sri Lanka played in Nagpur, two Indian batsmen together scored 176 runs. Express this information in the form of an equation.

Here, you can see that the score of neither of them is known, i.e., there are two unknown quantities. Let us use x and y to denote them. So, the number of runs scored by one of the batsmen is x, and the number of runs scored by the other is y. We know that

x + y = 176

This is an example of a linear equation in two variables. It is customary to denote the variables in such equations by x and y, but other letters may also be used.

Example 1 : Write each of the following equations in the form ax + by + c = 0 and indicate the values of a, b and c in each case:

  1. 2x + 3y = 4.37
  2. x – 4 = 3y
  3. 4 = 5x – 3y
  4. 2x = y

Solution :

  1. The equation 2x + 3y = 4.37 can be written as 2x + 3y – 4.37 = 0. Here a = 2, b = 3and c = – 4.37.
  2. The  equation  x  –  4  =  3y  can  be  written  as  x  –  3y  –  4  =  0. Here  a  =  1,b = –3 and c = – 4.
  3. The equation 4 = 5x – 3y can be written as 5x – 3y – 4 = 0. Here a = 5, b = –3and c = – 4.
  4. The equation 2x=y can be written as 2x-y+0=0. Here a = 2, b=-1, c=0


Graph of a Linear Equation in Two Variables

 How can we show a two variable equation on the coordinate plane or the graph? You may have got some indication in which we write the solution as pairs of values. 

Example 2: x + 2y = 6

By putting values in x and y, it can be expressed in the form of a table as follows:

by writing the values of y below the corresponding values of x.

You studied how to plot the points on a graph paper. Let us plot the points (0, 3), (2, 2), (4, 1) and (6, 0) on a graph paper.

Now join any of these two points and obtain a line. Let us call this as line AB. Do you see that the other two points also lie on the line AB?

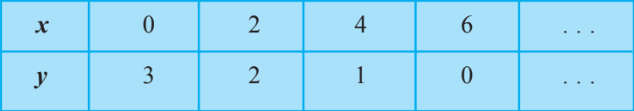
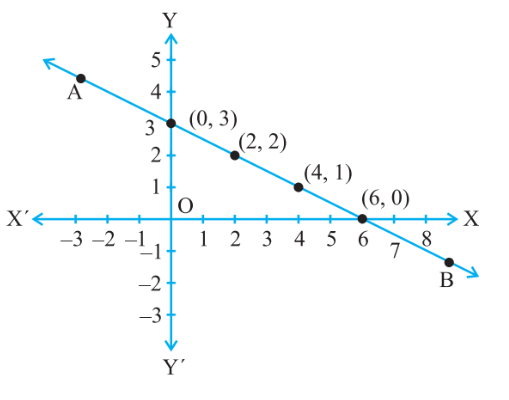
Now, pick another point on this line, say (8, –1). Is this a solution? In fact, 8 + 2(–1) = 6. So, (8, –1) is a solution.

Pick any other point on this line AB and verify whether its coordinates satisfy the equation or not. Now, take any point not lying on the line AB, say (2, 0). Do its coordinates satisfy the equation?

So, you can conclude that every point on the line satisfies the equation of the line and every solution of the equation is a point on the line. In fact, a linear equation in two variables is represented geometrically by a line whose points make up the collection of solutions of the equation.

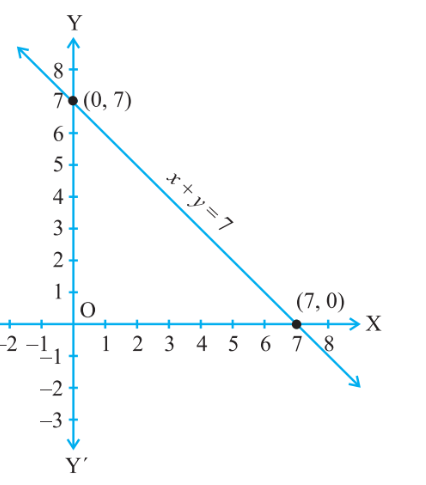
This is called the graph of the linear equation.

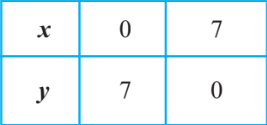
Example 3 : Draw the graph of x + y = 7.

Solution : To draw the graph, we need at least two solutions of the equation. You can check that x = 0, y = 7, and x = 7, y = 0 are solutions of the given equation. So, you can use the following table to draw the Graph:

Draw the graph by plotting the two points from Table and then by joining the same by a line.

Experiment: Determining Boiling point of water and Melting point of Ice

Melting Point: The temperature at which the solid changes into liquid at the atmospheric pressure is called melting point. For example, ice melts at 0°C to form water.

Boiling Point: The temperature at which the liquid boils and changes into gaseous state at the atmospheric pressure is called boiling point. For example, water boils at 100°C to form water vapour (at 76 cm pressure).

To determine the boiling point of water. Take 25-30 ml of water in a boiling tube and add a few pumice stones to it.

  1. Clamp the boiling tube on an iron stand with two holed cork, in one hole fix the thermometer and in the other one fix the delivery tube.
  2. Place the thermometer above the water in the flask as shown in the figure and record its temperature.
  3. Place a burner under the boiling tube.
  4. Read the temperature and record it in the given observation table till the water boils. Record the reading after the time interval of 1 minute.

To determine the melting point of ice.

  1. Take a beaker half-filled with the dry crushed ice obtained from distilled water.
  2. Suspend a Celsius thermometer from the clamp stand such that the bulb of the thermometer is completely surrounded by ice.
  3. Read the thermometer reading and record the temperature after every 1 minute till the ice melts and the thermometer reading remains stationary for 2 minutes.

Note the readings in the observation table.

JIVAN GYAN

-----FUN & LEARN-----